Conservation of Mechanical Energy

  • Consider a single conservative force doing work on a closed system

  • C:\25225E85\B09A51C6-0574-4A0C-A2C1-496768C10C63_files\image092.png

  • C:\25225E85\B09A51C6-0574-4A0C-A2C1-496768C10C63_files\image093.png

  • C:\25225E85\B09A51C6-0574-4A0C-A2C1-496768C10C63_files\image094.png

Non-Conservative Forces

  • Non-conservative forces change the total mechanical energy of a system, but not the total energy of a system

  • Work done by a non-conservative force is typically converted to internal (thermal) energy

  • C:\25225E85\B09A51C6-0574-4A0C-A2C1-496768C10C63_files\image095.png

  • C:\25225E85\B09A51C6-0574-4A0C-A2C1-496768C10C63_files\image096.png

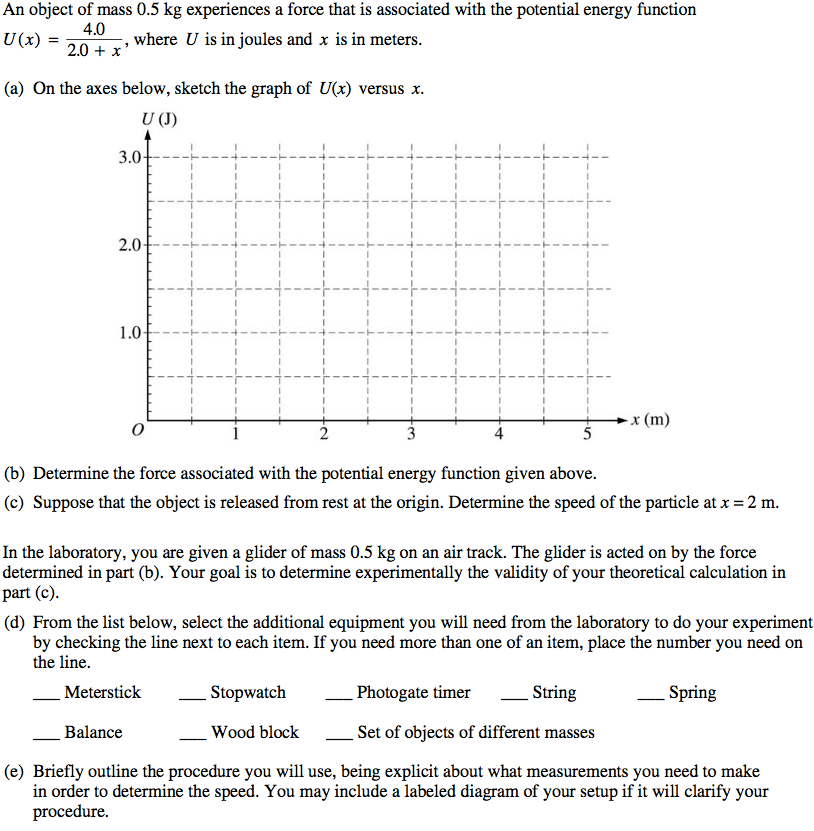
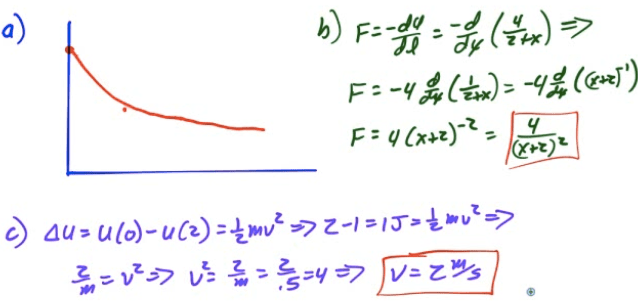
2002 Free Response Question 3

An object of mass 0.5 kg experiences a force that is associated with the potential energy function 4.0 where U is in joules and x is in meters. 20 + x' (a) On the axes below, sketch the graph of U(x) versus x. 3.0 2.0 1.0 2 3 4 5 (b) Determine the force associated with the potential energy function given above. (c) Suppose that the object is released from rest at the origin. Determine the speed of the particle at x = 2 m. In the laboratory, you are given a glider of mass 0.5 kg on an air track. The glider is acted on by the force determined in part (b). Your goal is to determine experimentally the validity of your theoretical calculation in part (c). (d) From the list below, select the additional equipment you will need from the laboratory to do your experiment by checking the line next to each item. If you need more than one of an item, place the number you need on the line. Meterstick Balance Stopwatch Wood block Photogate timer String Spring Set of objects of different masses (e) Briefly outline the procedure you will use, being explicit about what measurements you need to make in order to determine the speed. You may include a labeled diagram of your setup if it will clarify your procedure.

24

C:\25225E85\B09A51C6-0574-4A0C-A2C1-496768C10C63_files\image099.png

2007 Free Response Question 3

Photogate Spring Glider Air Track Mech. 3. The apparatus above is used to study conservation of mechanical energy. A spring of force constant 40 N/m is held horizontal over a horizontal air track, with one end attached to the air track A light string is attached to the other end of the spring and connects it to a glider of mass m . The glider is pulled to stretch the spring an amount x from equilibrium and then released. Before reaching the photogate, the glider attains its maximum speed and the string becomes slack. The photogate measures the time t that it takes the small block on top of the glider to pass through. Infornution about the distance x and the speed v of the glider as it passes through the photogate are given below. Speed of Glider Extension of the Spring Trial # 1 2 3 4 5 0.30 x lo- 0.60 x lo- 0.90 x lo- 1.2 x 10⁻¹ 1.5 x lo- v (m/s) 0.47 0.87 1.3 1.6 2.2 Extension Squared 0.09 x 10 2 0.36 x 10 2 0.81 x 10 2 1.4 x 10 2 2.3 x 10 2 Speed Squared 0.22 0.76 1.7 2.6 4.8 (a) Assuming no energy is lost, write the equation for conservation of mechanical energy that would apply to this situation. (b) On the grid below, plot v versus x . Label the axes, including units and scale.

(c) i. Draw a best-fit straight line through the data. ii. Use the best-fit line to obtain the mass m of the glider. (d) The track is now tilted at an angle 9 as shown below. When the spring is unstretched, the center of the glider is a height h above the photogate. The experiment is repeated with a variety of values of x. i. ii. x Assuming no energy is lost, write the new equation for conservation of mechanical energy that would apply to this situation. Will the graph of 02 versus x2 for this new experiment be a straight line? Yes Justify your answer. No

(q

05 : К

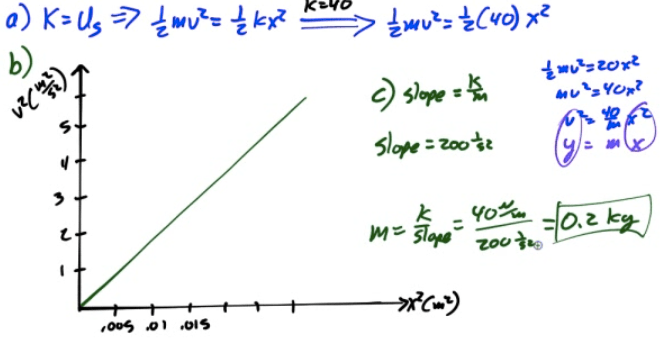
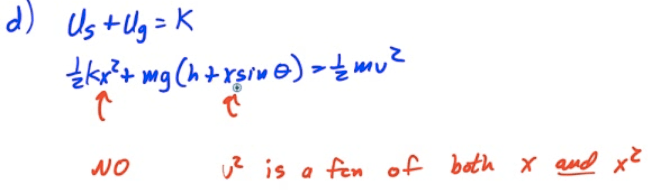
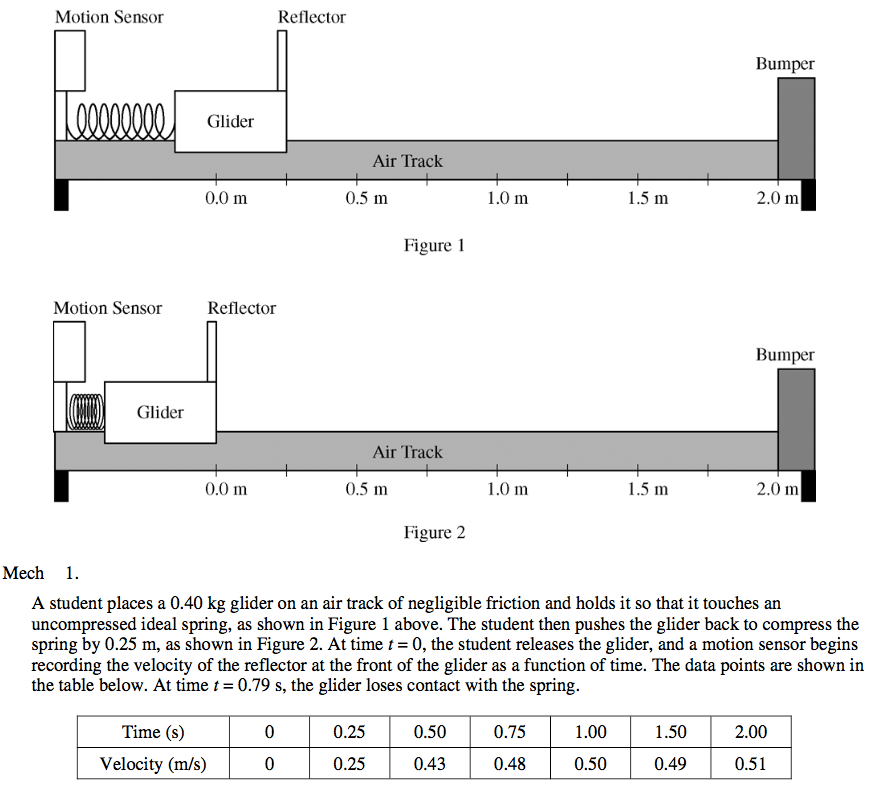
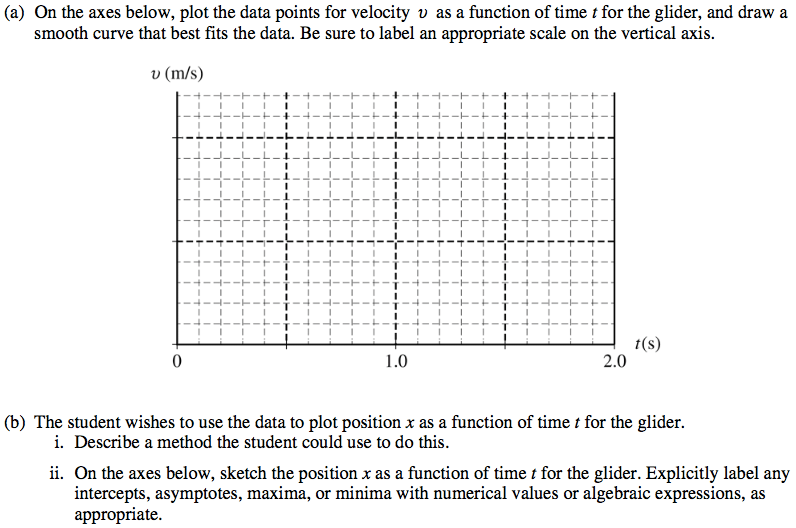
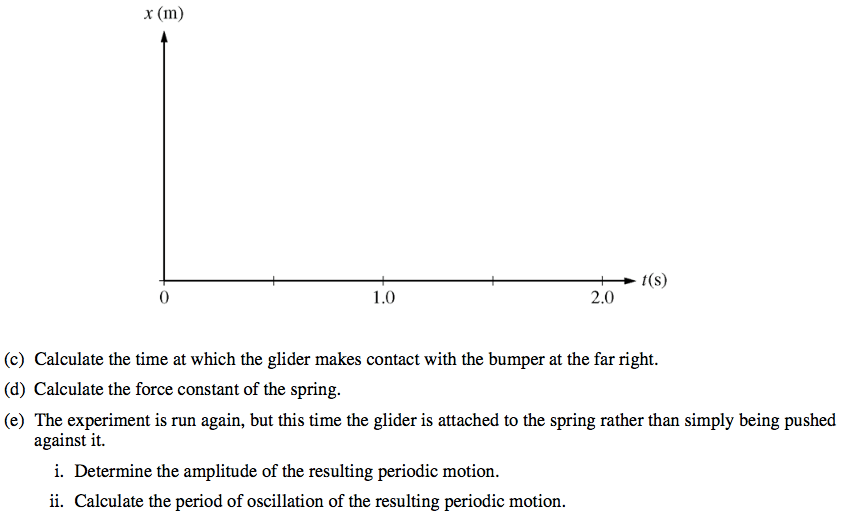
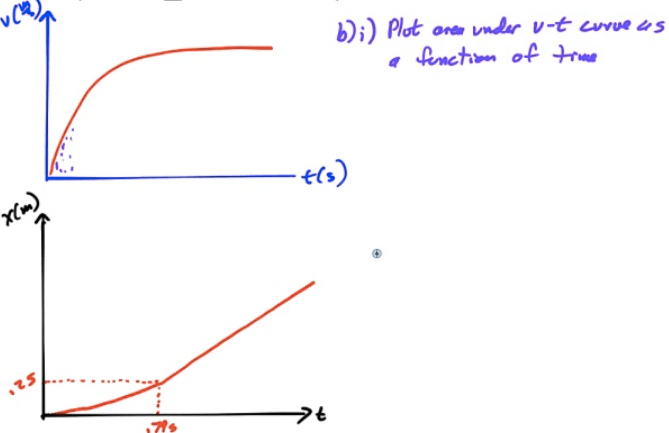
2010 Free Response Question 1

Mech. 1. Students are to conduct an experiment to investigate the relationship between the terminal speed of a stack of falling paper coffee filters and its mass. Their procedure involves stacking a number of coffee filters, like the one shown in the figure above, and dropping the stack from rest. The students change the number of filters in the stack to vary the mass m while keeping the shape of the stack the same. As a stack of coffee filters falls, there is an air resistance (drag) force acting on the filters. (a) The students suspect that the drag force FL) is proportional to the square of the speed : FL) = c02 , where C is a constant. Using this relationship, derive an expression relating the terminal speed VT to the mass m. The students conduct the experiment and obtain the following data. -3 Mass of the stack of filters, m (kg) 1.12 x 10 Terminal speed, VT (m/s ) (b) 0.51 2.04 x 10 3 0.62 —3 2.96 x 10 0.82 —3 4.18 x 10 0.92 -3 5.10 x 10 1.06 (i) Assuming the functional relationship for the drag force above, use the grid below to plot a linear graph as a function of m to verify the relationship. Use the empty boxes in the data table, as appropriate, to record any calculated values you are graphing. Label the vertical axis as appropriate, and place numbers on both axes.

(ii) Use your graph to calculate C. A particular stack of filters with mass m is dropped from rest and reaches a speed very close to terminal speed by the time it has fallen a vertical distance Y. (c) (i) Sketch an approximate graph of speed versus time from the time the filters are released up to the time t = T that the filters have fallen the distance Y. Indicate time t = T and terminal speed v = on the graph. (ii) Suppose you had a graph like the one sketched in (c)(i) that had a numerical scale on each axis. Describe how you could use the graph to approximate the distance Y. (d) Determine an expression for the approximate amount of mechanical energy dissipated, AE , due to air resistance during the time the stack falls a distance y, where y > Y . Express your answer in terms of y , m, and fundamental constants.

C:\25225E85\B09A51C6-0574-4A0C-A2C1-496768C10C63_files\image106.png

11

C:\25225E85\B09A51C6-0574-4A0C-A2C1-496768C10C63_files\image108.png

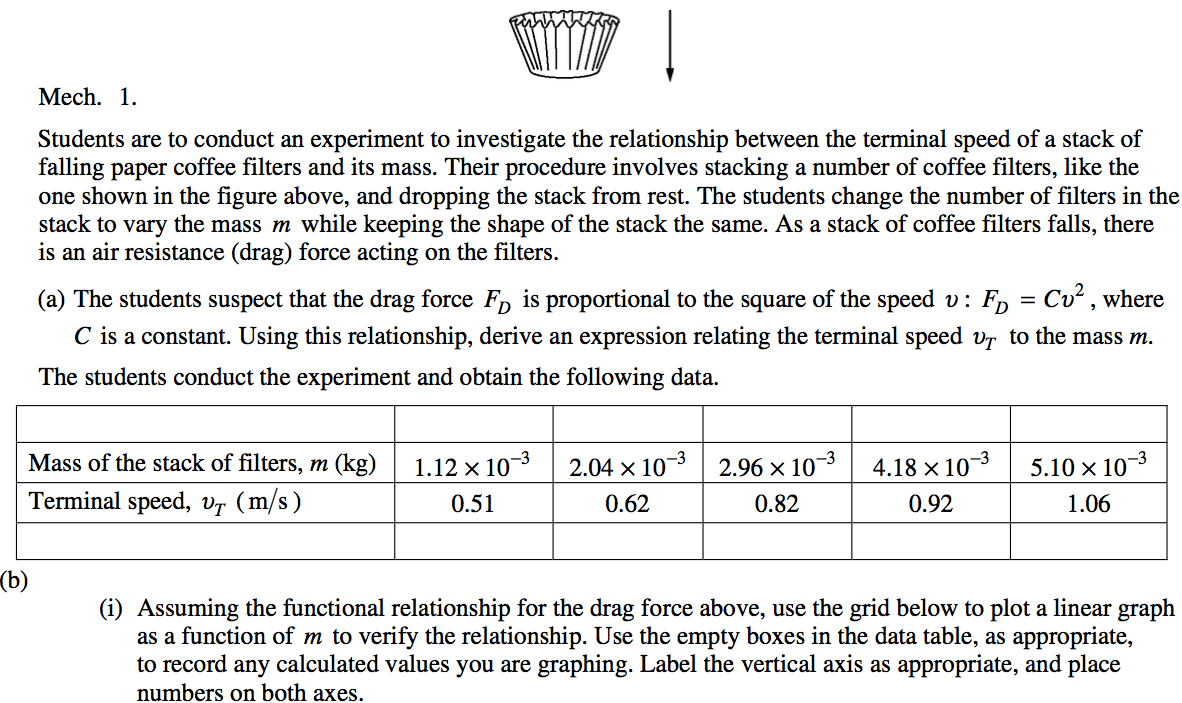
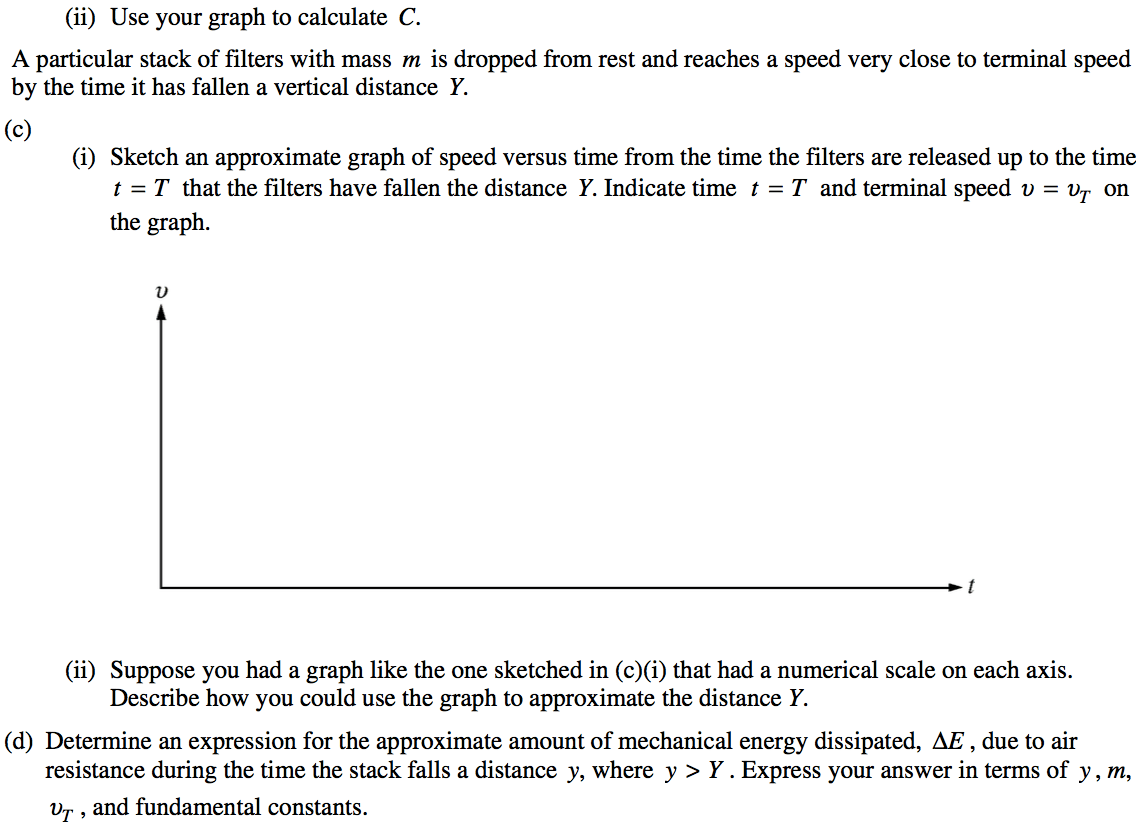
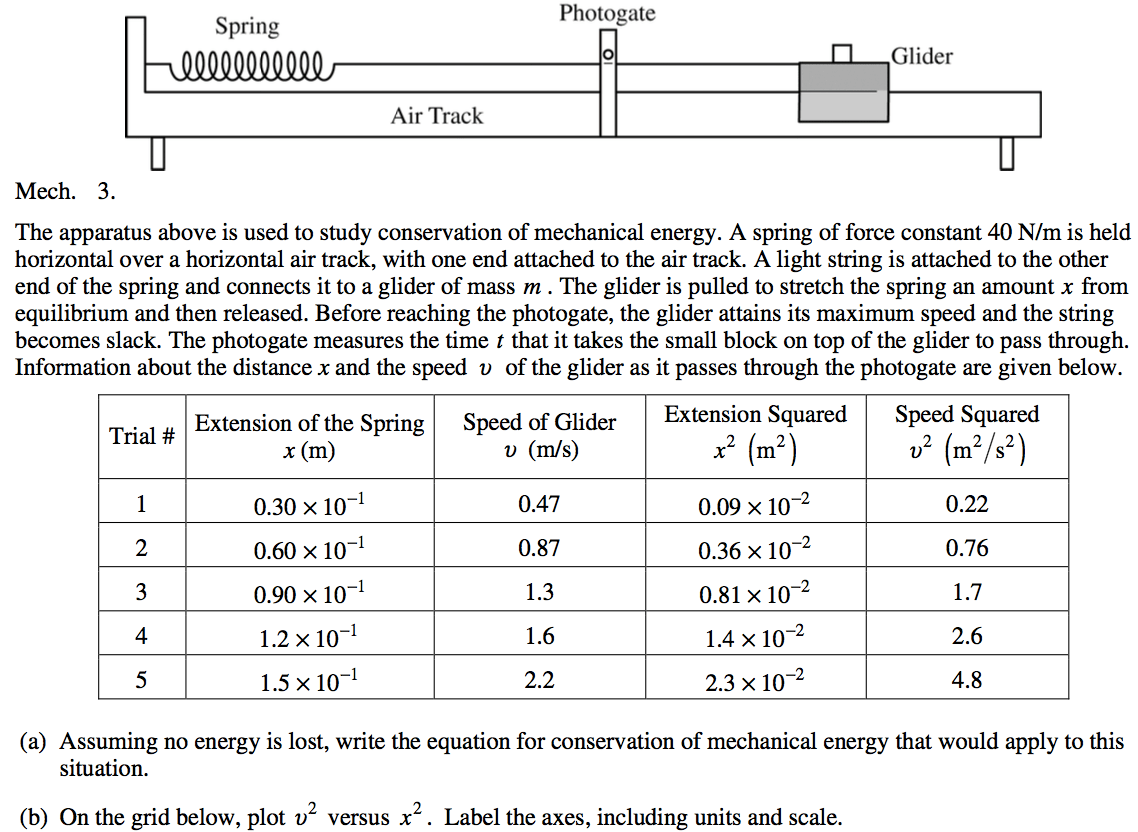
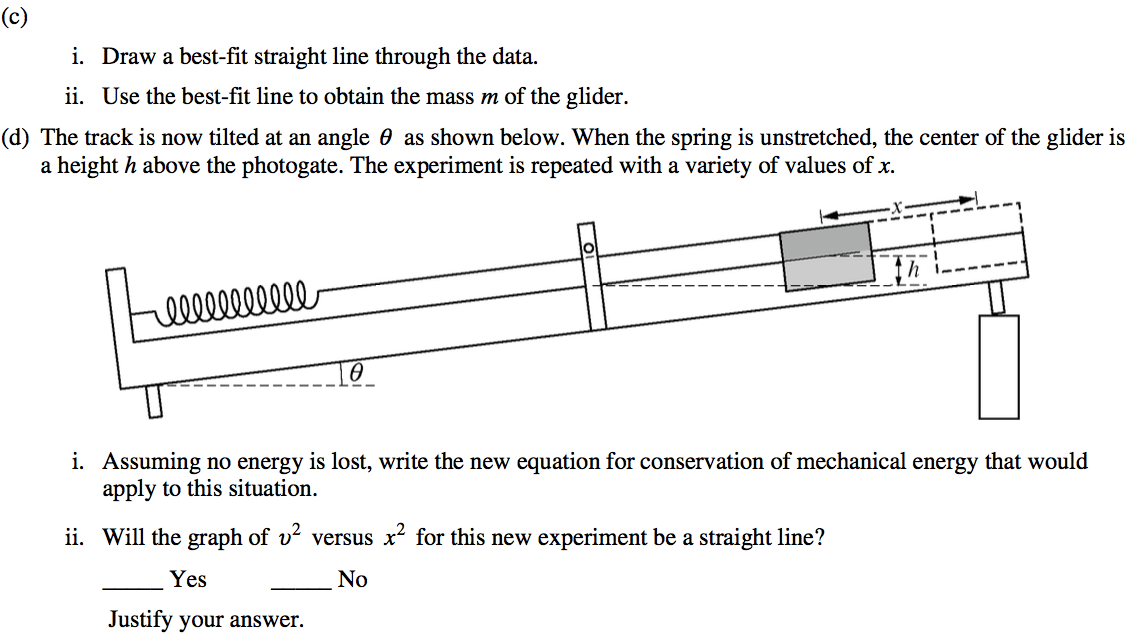
2013 Free Response Question 1

Motion Sensor Motion Sensor Reflector Glider 0.0 m Reflector Glider 0.0 m Mech 1. Air Track 0.5 m Figure I Air Track 0.5 m Figure 2 1.0 m 1.0 m 1.5 m 1.5 m Bumper 2.0 m Bumper 2.0 m A student places a 0 40 kg glider on an air track of negligible friction and holds it so that it touches an uncompressed ideal spring, as shown in Figure I above. The student then pushes the glider back to compress the spring by 0.25 m, as shown in Figure 2. At time t = 0, the student releases the glider, and a motion sensor begins recording the velocity of the reflector at the front of the glider as a function of time. The data points are shown in the table below. At time t = 0.79 s, the glider loses contact with the spring. Time (s) Velocity (m/s) o o 0.25 0.25 0.50 0.43 0.75 0.48 1.00 0.50 1.50 0.49 2.00 0.51

(a) On the axes below, plot the data points for velocity v as a function of time t for the glider, and draw a smooth curve that best fits the data. Be sure to label an appropriate scale on the vertical axis. v (m/s) 1.0 t(s) 2.0 (b) The student wishes to use the data to plot position x as a function of time t for the glider. i. Describe a method the student could use to do this. ii. On the axes below, sketch the position x as a function of time t for the glider. Explicitly label any intercepts, asymptotes, maxima, or minima with numerical values or algebraic expressions, as appropriate.

0 1.0 2.0 (c) Calculate the time at which the glider makes contact with the bumper at the far right. (d) Calculate the force constant of the spring. (e) Ihe experiment is run again, but this time the glider is attached to the spring rather than simply being pushed against it. i. Determine the amplitude of the resulting periodic motion. ii. Calculate the period of oscillation of the resulting periodic motion.

C:\25225E85\B09A51C6-0574-4A0C-A2C1-496768C10C63_files\image112.png

results matching ""

    No results matching ""